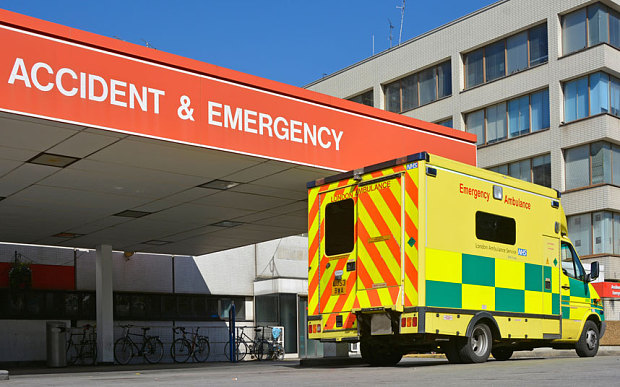
The closest I have got to experiencing the demands on Accident and Emergency (A&E) is watching the TV series MASH, but recently I was right in the middle of it!
Waiting for attention I was interested in the way that the staff were managing the wide range of medical problems that were rolling through the door. There were: people holding limbs in great pain, a head covered in sticking plasters, two to three people bright red and coughing, a queue of wheel chairs with legs in plaster, and somebody hobbling around in too much pain to sit down. In the background Ambulances were rushing in and trollies were rattling along corridors. All of this activity is, in a management sense, ‘unplanned’ e.g. people could arrive at A&E anytime of the day or night with a wide range of problems. I started to wonder how a typical A&E is organised and operates to manage the situation and to meet the 4 hour waiting target.
A few days later I was waiting in another queue this time in my local coffee shop. As I slowly moved along I did a quick sum1 to work out how long I would have to wait and came up with the following calculation:
If the queue had been longer then I would have waited longer. Or if there had been more staff serving then the quicker the service and the shorter the waiting time. To apply the same approach to A&E I took some statistics from the data published monthly on A&E performance where the average number of people attending A&E per hour is approximately 12 / hour ( on average there are 8,500 people attending A&E for each hospital in NHS England per month ). I also assumed that a typical A&E department can manage 10 cases per hour then the using the same approach as a the coffee shop I calculated:
which was close to my experience in A&E. The calculation confirms what we would expect: if the A&E department’s capacity was increased by adding more doctors and nurses then the waiting time would reduce. Similarly if the number of people attending A&E was reduced then the waiting time reduces.
Of course the calculation is too simplistic to be applied to the complex operation of an A&E Department because it assumes average quantities. But trying to answer the question: Why can it not be applied ? - highlights some of the underlying factors that are adding to the complexity of its operation.
Starting with the average arrival rate of A&E attendees, A&E statistics show that there is a wide variability during a typical week. For example Monday is the busiest day at A&E with attendance 13% above the daily average and also 13% above the next - busiest day, Sunday. Also, in 2013/14, 24% of A&E attendances arrived by ambulance or helicopter who require immediate attention. All of this starts to show the variability in the arrival rate of people requiring medical attention.
Similarly the wide range of patient’s medical problems will affect an A&E department’s capacity to manage their diagnosis and subsequent treatment. For example if there was a major emergency situation, say a train crash or a flu epidemic, then the capacity of A&E would be overloaded. Another area is diagnosing the medical condition. For example 3% of patients attending A&E have severe life threatening conditions and must be seen immediately. Also, if about 40% of attendees are not seen within an an hour of arrival at A&E their condition could deteriorate to life threatening.
There are many more factors affecting the performance of A&E for example the well publicised bed blocking and transfer to social care which can increase the time seen by the doctors and nurses. Other factors are not so obvious for example the impact of weather - when average daily temperatures hit 20°C compared with 5°C, trips to A&E rise by nearly 20%. However, very cold weather does also cause longer waits.
Although the assumption of using average quantities to describe the operation of A&E is over simplistic, asking the question “why do the assumptions break down ?” can gives a better understanding of the underlying factors that contribute to its performance. Based on my experience, the way that the staff manage the range of the medical problems that come through the doors of A&E is much more impressive than the TV characters Hawkeye or Trapper John!
1. More formally the calculation is an example of Little's Law which states that the long-term average number of customers in a stable system L is equal to the long-term average effective arrival rate, λ, multiplied by the average time a customer spends in the system, W. For a different and more detailed discussion on the application of Little's Law to staffing levels in A&E see: Little’s Law: The Science Behind Proper Staffing
